Daily review for October 21, 2021
Bitcoin and Ethereum hit record highs. Traders start taking profits. Higher liquidity expected in the crypto market.
DAX 40 in sideway, waiting for the results of the EU leaders’ summit. The two main topics of discussion are economic recovery and dependence on raw materials for power generation.
WTI reaches USD$83 per barrel. In the United States, crude inventories decreased by 431,000 barrels. Domestic demand continues to increase.
Traders maintain purchases in gold. Bulls start to look for the USD$1,800 per Troy ounce zone.
| BITCOIN +1.59% |
| During yesterday’s session, the Bitcoin reached an all-time high of USD$67,303. This was driven by multiple factors, among them the good performance and market acceptance of the Bitcoin ETF BITO, and by statements from big Fund Managers such as Carl Icahn and Paul Tudor Jones who communicated that Bitcoin is a safe haven asset against inflation. At this moment traders are starting to take a round of profits. Bitcoin is currently up 1.59% and is trading at USD$65.019. |
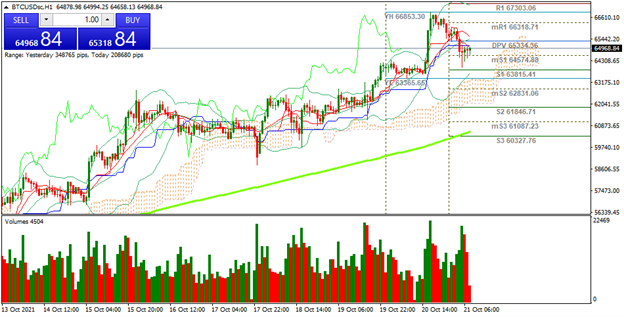 |
| Support 1: 64,724.8 Support 2: 64,410.1 Support 3: 64,186.5 Resistance 1: 65,263.0 Resistance 2: 65,486.5 Resistance 3: 65,801.2 Pivot Point: 64,948.3 |
| The price is still above the 200-day moving average. At the moment it is between the pivot point and support 1. If traders continue to take profits, the price could give way to support 2 and 3. Trading range between USD$64,186 and USD$65,801. Pivot point at USD$64,948. RSI neutral. |
| DAX 40 -0.28% |
| Today is the summit of European Union leaders. It will mainly discuss the economic recovery for the Euro Zone and Europe’s dependence on raw materials for energy generation. At the moment the DAX 40 is down 0.28% and is trading at 15,452. European futures remain mixed. One of the main topics of discussion is North Stream 2. Europe needs a constant supply of Natural Gas, and the project is part of the point of discussion. In the meantime, the index is moving sideways, awaiting the volatility of corporate results. |
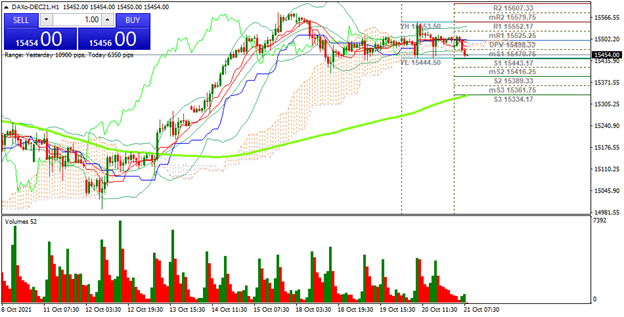 |
| Support 1: 15,463.0 Support 2: 15,453.0 Support 3: 15,440.0 Resistance 1: 15,486.0 Resistance 2: 15,499.0 Resistance 3: 15,509.0 Pivot Point: 15,476.0 |
| The price is above the 200-day moving average. Sideways movement above 15,448. Trading range between 15,486 and 15,509. Pivot point for trend change at 15,476. Neutral RSI approaching the oversold zone, so the price could present a rebound towards resistance 1. |
| WTI -0.07% |
| Surprisingly, crude oil inventories in the United States decreased by 431,000 barrels, which evidences the stability of crude oil demand. This caused the price to reach resistance level 1 at USD$83.62 per barrel. Traders are looking to revise the current price level by analyzing imports from China and Japan. If the purchase levels of these countries are maintained or increased, the price could start looking for USD$90. The Brent benchmark is trading at USD$85.61 per barrel. |
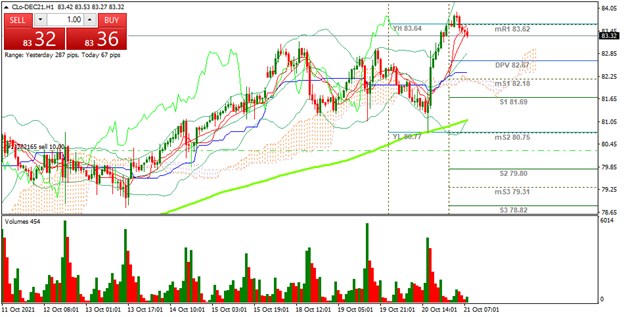 |
| Support 1: 83.34 Support 2: 83.23 Support 3: 83.15 Resistance 1: 83.53 Resistance 2: 83.61 Resistance 3: 83.72 Pivot Point: 83.42 |
| Important bounce from support 2. The price broke away from the 200-day moving average line. Trading range between USD$83.32 and USD$80.45. Pivot point for trend change at USD$83.42. Neutral RSI coming out of the overbought zone. |
| GOLD +0.20% |
| Gold price recovered the zone of USD$1,780 per Troy ounce. At the moment the price is up 0.20% and is trading at USD$1,784 per Troy ounce. Given the current market conditions and the fear and greed index, pointing towards greed, traders keep buying the metal. They are looking to hedge against volatility generated by corporate earnings, and also to hedge against inflation. If appetite continues, the price could reach the USD$1,800 area. During the Asian session, gold futures rose, due to the return to the market of Evergrande shares, which fell 10%. |
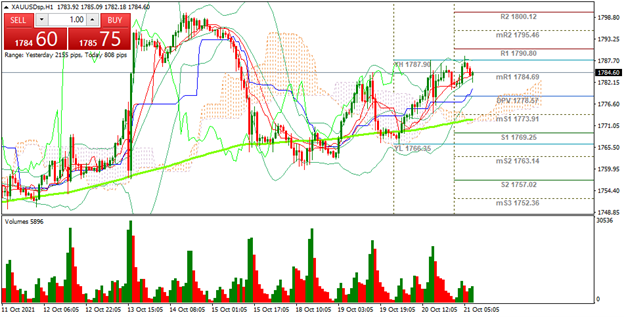 |
| Support 1: 1,783.70 Support 2: 1,782.75 Support 3: 1,781.24 Resistance 1: 1,786.16 Resistance 2: 1,787.67 Resistance 3: 1,788.62 Pivot Point: 1,785.21 |
| The price is above the 200-day moving average. Expected trading range between USD$1,781 and USD$1,788. Pivot point for trend change at USD$1,785. RSI approaching the overbought level. |
| Sources |
| Reuters Market watch Bloomberg Capitalix Market Research |
Risk Disclaimer
Any information/articles/materials/content provided by Capitalix or displayed on its website is intended to be used for educational purposes only and does not constitute investment advice or a consultation on how the client should trade.
Although Capitalix has ensured that the content of such information is accurate, it is not responsible for any omission/error/miscalculation and cannot guarantee the accuracy of any material or any information contained herein.
Therefore, any reliance you place on such material is strictly at your own risk. Please note that the responsibility for using or relying on such material rests with the client and Capitalix accepts no liability for any loss or damage, including without limitation, any loss of profit which may arise directly or indirectly from the use of or reliance on such information.
Risk Warning: Forex/CFDs trading involves significant risk to your invested capital. Please read and make sure that you fully understand our Risk Disclosure Policy.
You should ensure that, depending on your country of residence, you are allowed to trade Capitalix.com products. Please ensure that you are familiar with the company’s risk disclosure.